What is consonance?
In the previous note, we found out how sound works. Let’s repeat this formula:
SOUND = GROUND TONE + ALL MULTIPLE OVERTONS
In addition, as the Japanese admire the cherry blossoms, we will also admire the frequency response graph – the amplitude-frequency characteristic of sound (Fig. 1):
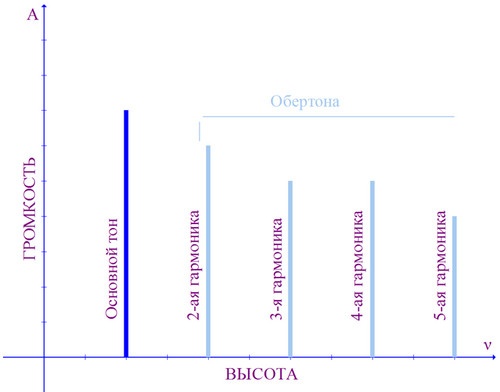
Recall that the horizontal axis represents the pitch (oscillation frequency), and the vertical axis represents the loudness (amplitude).
Each vertical line is a harmonic, the first harmonic is usually called the fundamental. Harmonics are arranged as follows: the second harmonic is 2 times higher than the fundamental tone, the third is three, the fourth is four, and so on.
For the sake of brevity, instead of “frequency nth harmonic” we will simply say “nth harmonic”, and instead of “fundamental frequency” – “sound frequency”.
So, looking at the frequency response, it will not be difficult for us to answer the question, what is consonance.
How to count to infinity?
Consonance literally means “co-sounding”, joint sounding. What can two different sounds sound like together?
Let’s draw them on the same chart under each other (Fig. 2):
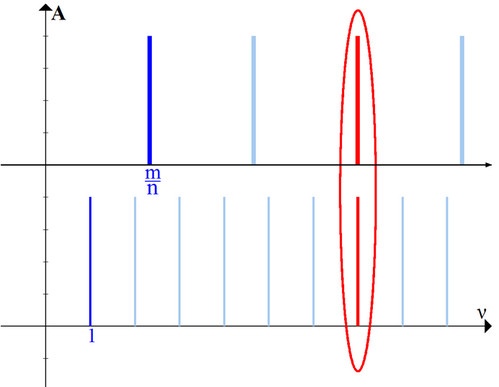
Here is the answer: some of the harmonics can coincide in frequency. It is logical to assume that the more matching frequencies, the more “common” sounds have, and, consequently, the more consonance in the sound of such an interval. To be completely precise, it is important not just the number of matching harmonics, but what proportion of all sounding harmonics matches, that is, the ratio of the number of matching to the total number of sounding harmonics.
We get the simplest formula for calculating consonance:

where Nsovp is the number of matching harmonics, Ncommon is the total number of sounding harmonics (the number of different sounding frequencies), and cons and is our desired consonance. To be mathematically correct, it is better to call the quantity a measure of frequency consonance.
Well, the matter is small: you need to calculate Nsovp и Ncommon, divide one by the other, and get the desired result.
The only problem is that both the total number of harmonics and even the number of matching harmonics is infinite.
What happens if we divide infinity by infinity?
Let’s change the scale of the previous chart, “move away” from it (Fig. 3)
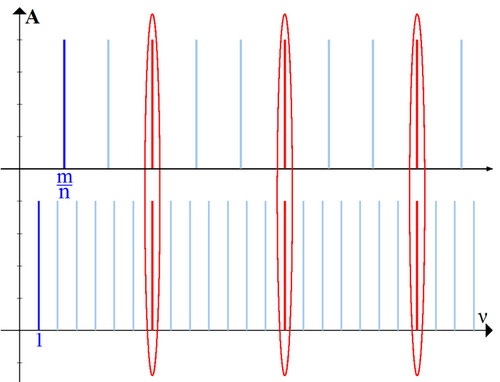
We see that matching harmonics occur again and again. The picture is repeated (Fig. 4).
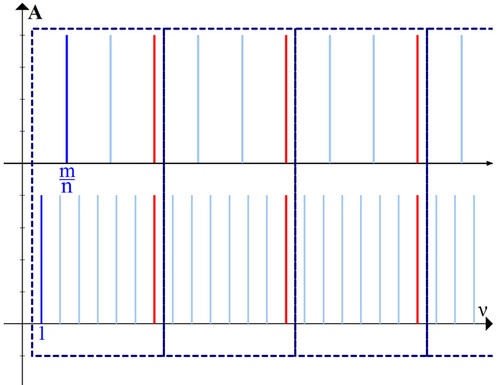
This repetition will help us.
It is enough for us to calculate the ratio (1) in one of the dotted rectangles (for example, in the first one), then, due to repetitions and on the whole line, this ratio will remain the same.
For simplicity, the frequency of the fundamental tone of the first (lower) sound will be considered equal to unity, and the frequency of the fundamental tone of the second sound will be written as an irreducible fraction  .
.
Let us note in parentheses that in musical systems, as a rule, it is precisely sounds that are used, the ratio of frequencies of which is expressed by some fraction  . For example, the interval of a fifth is the ratio
  , quarts –
  , triton —
  etc.
etc.
Let’s calculate ratio (1) inside the first rectangle (Fig. 4).
It is fairly easy to count the number of matching harmonics. Formally, there are two of them, one belongs to the lower sound, the second – to the upper, in Fig. 4 they are marked in red. But both of these harmonics sound at the same frequency, respectively, if we count the number of matching frequencies, then there will be only one such frequency.

What is the total number of sounding frequencies?
Let’s argue like this.
All harmonics of the lower sound are arranged in whole numbers (1, 2, 3, etc.). As soon as any harmonic of the top sound is an integer, it will coincide with one of the harmonics of the bottom. All harmonics of the upper sound are multiples of the fundamental tone  , so the frequency n-th harmonic will be equal to:

that is, it will be an integer (since m is an integer). This means that the upper sound in the rectangle has harmonics from the first (fundamental tone) to n-oh, therefore, sound n frequencies.
Since all harmonics of the lower sound are located in integer numbers, and according to (3), the first coincidence occurs at the frequency m, it turns out that the lower sound inside the rectangle will give m sounding frequencies.
It should be noted that the coinciding frequency m we again counted twice: when we counted the frequencies of the upper sound and when we counted the frequencies of the lower sound. But in fact, the frequency is one, and for the correct answer, we will need to subtract one “extra” frequency.
The total of all sounding frequencies inside the rectangle will be:

Substituting (2) and (4) into formula (1), we obtain a simple expression for calculating the consonance:

To emphasize the consonance of which sounds we calculated, you can indicate these sounds in brackets cons:

Using such a simple formula, you can calculate the consonance of any interval.
And now let’s consider some properties of frequency consonance and examples of its calculation.
Properties and examples
First, let’s calculate the consonances for the simplest intervals and make sure that formula (6) “works”.
What interval is the simplest?
Definitely prima. Two notes sound in unison. On a chart it will look like this:
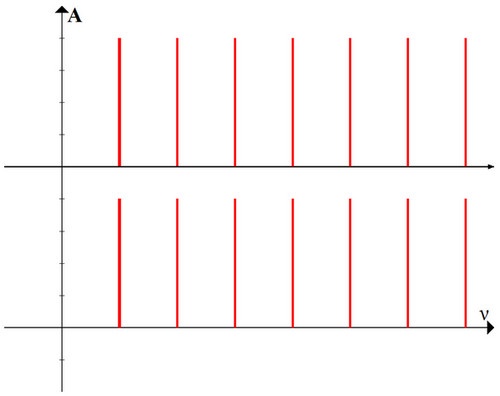
We see that absolutely all sounding frequencies coincide. Therefore, the consonance must be equal to:

Now let’s substitute the ratio for the unison  into formula (6), we get:

The calculation coincides with the “intuitive” answer, which is to be expected.
Let’s take another example in which the intuitive answer is just as obvious – the octave.
In an octave, the upper sound is 2 times higher than the lower one (according to the frequency of the fundamental tone), respectively, on the graph it will look like this:
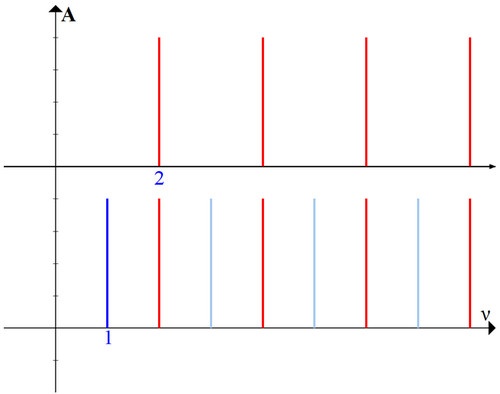
It can be seen from the graph that every second harmonic coincides, and the intuitive answer is: the consonance is 50%.
Let’s calculate it by formula (6):

And again, the calculated value is equal to the “intuitive”.
If we take the note as the lower sound to and plot the consonance value for all intervals within the octave on the graph (simple intervals), we get the following picture:
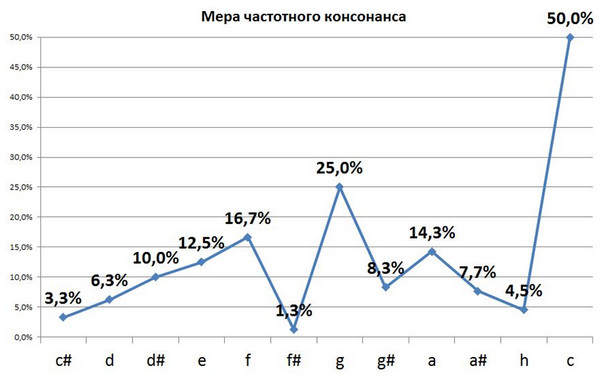
The highest measures of consonance are in the octave, fifth and fourth. They historically referred to “perfect” consonances. The minor and major thirds, and the minor and major sixth are slightly lower, these intervals are considered “imperfect” consonances. The rest of the intervals have a lower degree of consonance, traditionally they belong to the group of dissonances.
Now we list some properties of the measure of frequency consonance, which come from the formula for its calculation:
- The more complex the ratio
 (the more number m и n), the less consonant the interval.
И m и n in formula (6) are in the denominator, therefore, as these numbers increase, the measure of consonance decreases.
- The upward consonance of the interval is equal to the downward consonance of the interval.
To get a down interval instead of an up interval, we need in the ratio  swap m и n. But in formula (6), absolutely nothing will change from such a replacement.
- The measure of the frequency consonance of an interval does not depend on what note we are building it from.
If you shift both notes by the same interval up or down (for example, build a fifth not from a note to, but from the note ре), then the ratio  between notes will not change, and consequently, the measure of frequency consonance will remain the same.
We could give other properties of consonance, but for now we will restrict ourselves to these.
Physics and lyrics
Figure 7 gives us an idea of how consonance works. But is this how we really perceive the consonance of intervals? Are there people who do not like perfect consonances, but the most dissonant harmonies seem pleasant?
Yes, such people certainly exist. And in order to explain this, two concepts should be distinguished: physical consonance и perceived consonance.
Everything that we have considered in this article has to do with physical consonance. To calculate it, you need to know how the sound works, and how different vibrations add up. Physical consonance provides the prerequisites for perceived consonance, but does not determine it 100%.
Perceived consonance is determined very simply. A person is asked if he likes this consonance. If yes, then for him it is consonance; if not, it is dissonance. If he is given two intervals for comparison, then we can say that one of them will seem to the person at the moment more consonant, the other less.
Can perceived consonance be calculated? Even if we assume that it is possible, then this calculation will be catastrophically complicated, it will include one more infinity – the infinity of a person: his experience, hearing characteristics and brain abilities. This infinity is not so easy to deal with.
However, research in this area is ongoing. In particular, the composer Ivan Soshinsky, who kindly provides audio materials for these notes, has developed a program with which you can build an individual map of the perception of consonances for each person. The site mu-theory.info is currently being developed, where anyone can be tested and find out the features of their hearing.
And yet, if there is a perceived consonance, and it differs from the physical, what is the point in calculating the latter? We can reformulate this question in a more constructive way: how do these two concepts relate?
Studies show that the correlation between average perceived consonance and physical consonance is on the order of 80%. This means that each person may have their own individual characteristics, but the physics of sound makes an overwhelming contribution to the definition of consonance.
Of course, scientific research in this area is still at the very beginning. And as a sound structure, we took a relatively simple model of multiple harmonics, and the calculation of consonance was used the simplest – frequency, and did not take into account the peculiarities of the brain’s activity in processing the sound signal. But the fact that even within the framework of such simplifications a very high degree of correlation between theory and experiment has been obtained is very encouraging and stimulates further research.
The application of the scientific method in the field of musical harmony is not limited to the calculation of consonance, it also yields more interesting results.
For example, with the help of the scientific method, musical harmony can be depicted graphically, visualized. We will talk about how to do this next time.
Author – Roman Oleinikov


